






Trading expectancy is the average amount a strategy gains or loses per trade across a large sample. The formula is (Win rate x Average win) - (Loss rate x Average loss). A positive result means the rules produced a net gain historically after costs. It does not promise future profit, and it says nothing about the losing runs along the way.
Key Takeaways
- Trading expectancy measures gain or loss per trade, not per winning trade. Calculate it after spread, commission, swap, and slippage.
- Win rate alone tells you nothing. A strategy winning 35 per cent of the time can hold positive expectancy, while one winning 80 per cent of the time can lose money.
- For the same trades, units and cost treatment, positive expectancy corresponds to profit factor above 1 when gross loss is nonzero. Positive expectancy means profit factor above 1.0, because both compare total gains against total losses.
- A positive average hides the path. Assuming independent trades with a constant 35 per cent win probability, eight or more consecutive losses appear in roughly 69 per cent of 100-trade samples.
- For funded-account traders, the losing run matters more than the average. A strategy with a real edge can still breach a daily loss limit.
Table of contents
- Key Takeaways
- What Is Trading Expectancy?
- The Trading Expectancy Formula
- How to Calculate Expectancy From Your Trade History
- What Is Profit Factor in Trading?
- Expectancy Compared With Win Rate, Risk-Reward and Profit Factor
- Why Positive Expectancy Can Still Fail a Prop Firm Challenge
- How to Track Expectancy by Setup, Session and Instrument
- Frequently Asked Questions
What Is Trading Expectancy?
Trading expectancy is the average result of a single trade, measured across every trade a strategy took. It combines how often you win with how much you win and lose. But most traders track win rate instead, which is why so many profitable-looking strategies quietly lose money.
The trading coach Van K. Tharp popularised the measure in Trade Your Way to Financial Freedom, where he expressed it in R-multiples: the average return per unit of risk. The underlying idea is simply expected value applied to a trade log.
So expectancy answers one question. If you take this trade a thousand times, what happens on average? Everything else, including win rate and reward-to-risk ratio, feeds into that single number.
The Trading Expectancy Formula
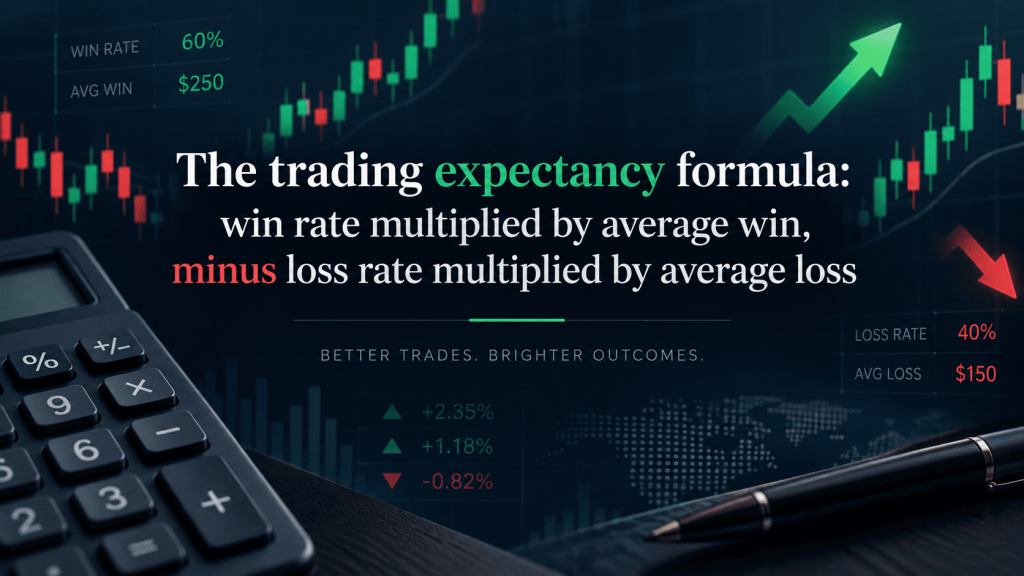
Expectancy = (Win rate x Average win) - (Loss rate x Average loss)Four inputs, all taken from your own closed trades:
| Input | Definition |
|---|---|
| Win rate | Winning trades divided by total trades |
| Average win | Total gains divided by number of winning trades |
| Loss rate | Losing trades divided by total trades |
| Average loss | Total losses divided by number of losing trades |
The result is a currency amount per trade, or an R-multiple if you work in units of risk. Either form works. R-multiples travel better between account sizes, so systematic traders tend to prefer them.
Worked Example One: A Low Win Rate With Positive Expectancy
Consider an illustrative sample of 100 closed trades, all figures net of costs.
| Measure | Value |
|---|---|
| Winning trades | 35 |
| Losing trades | 65 |
| Average win | 600 |
| Average loss | 200 |
Expectancy = (0.35 x 600) – (0.65 x 200) = 210 – 130 = +80 per trade
Across those 100 trades the strategy returned 8,000. Yet the trader lost roughly two trades out of every three. Nevertheless, the winners were three times the size of the losers, so the arithmetic works.
Worked Example Two: A High Win Rate With Negative Expectancy
Now consider the reverse, using the same illustrative 100-trade sample size.
| Measure | Value |
|---|---|
| Winning trades | 80 |
| Losing trades | 20 |
| Average win | 100 |
| Average loss | 500 |
Expectancy = (0.80 x 100) – (0.20 x 500) = 80 – 100 = -20 per trade
Across 100 trades this strategy lost 2,000, despite winning four times out of five. For example, this pattern appears often in strategies that cut winners quickly and let losers run. The equity curve looks smooth for weeks, then one cluster of losses erases months of gains.
Together these two examples make the point. Win rate is not evidence of an edge.
Calculating Expectancy in R When Risk Varies
Divide each trade’s final net result by its initial planned risk amount, then average those R-multiples, including zeros. Use risk recorded at entry, not a stop distance revised later.
| Illustrative trade | Initial risk | Net result | Result in R |
|---|---|---|---|
| A | 100 | +200 | +2R |
| B | 500 | -500 | -1R |
| C | 100 | 0 | 0R |
Average R expectancy = (2 – 1 + 0) / 3 = +0.33R per trade.
Currency expectancy = (200 – 500 + 0) / 3 = -100 per trade.
Currency profit factor = 200 / 500 = 0.40.
More money was risked on the loser, so positive average R coexists with a monetary loss. Normalise each trade separately; dividing currency expectancy by average risk does not generally produce average R expectancy. This tiny sample illustrates arithmetic, not evidence of a reliable edge.
How to Calculate Expectancy From Your Trade History
First you need a complete record of closed trades. So export it from your platform or journal, then work through five steps.
Step 1: Use net figures only. Use each trade’s final net result and subtract only costs not already included in the export. Executed prices already reflect spread and slippage; commission and swap may appear separately. Gross expectancy flatters every strategy. A result of +5 per trade turns negative once round-trip costs reach 7.
Step 2: Decide how to treat breakeven trades. A trade closing at exactly zero belongs in your total trade count but in neither the win pool nor the loss pool. Excluding it increases the absolute magnitude of expectancy: positive averages become more positive and negative averages more negative. The cleanest method counts it in total trades, with a zero contribution.
Step 3: Separate wins and losses before averaging. Average the winners among themselves and the losers among themselves. Averaging all trades together gives you expectancy directly, but it hides the win rate and average sizes you need for diagnosis.
Step 4: Avoid double-counting costs. This trips up most traders. If your platform already reports net profit per trade, do not subtract commission again. Check one trade manually against your statement before you trust the whole export.
Step 5: Check your sample. Twenty trades tell you almost nothing. Expectancy stabilises slowly, and the number you need depends on how variable your results are and how many market conditions the sample covers.
How Do You Handle Breakeven Trades?
Count breakeven trades in your total trade count and assign them a value of zero. Do not remove them from the sample. Dropping them increases expectancy’s absolute magnitude and, if there are winners, the apparent win rate. A stop at entry counts as breakeven only if its final result is zero after costs. This matters most for strategies that move stops to entry, since those produce many scratched trades by design.

What Is Profit Factor in Trading?
Profit factor is gross profit divided by gross loss across a set of trades. It expresses how much a strategy earned for every unit it lost. A profit factor of 1.5 means the strategy gained 1.50 for every 1.00 it gave back. Below 1.0, the strategy lost money over the sample.
The Profit Factor Formula
Profit factor = Gross profit / Gross lossHere gross profit sums positive net trade results after costs. Similarly, gross loss sums negative net trade results after costs, taken as a positive number. Apply it to the two examples above:
| Sample | Gross profit | Gross loss | Profit factor | Expectancy |
|---|---|---|---|---|
| Example one | 21,000 | 13,000 | 1.62 | +80 |
| Example two | 8,000 | 10,000 | 0.80 | -20 |
Notice that the two measures agree. That is not a coincidence, and it is worth understanding.
How Expectancy and Profit Factor Are Related
Expectancy multiplied by the number of trades equals gross profit minus gross loss. So expectancy is positive exactly when gross profit exceeds gross loss, which is exactly when profit factor exceeds 1.0. This identity requires the same trades, units and cost treatment. Profit factor is nonnegative even when expectancy is negative. With no losses, its denominator is zero and there is no finite ratio. Average R expectancy and currency profit factor can disagree when initial risk varies between trades.
They differ in what they tell you next. Expectancy gives a size: how much per trade, in currency or R. Profit factor gives a ratio: the ratio of realised gains to realised losses. Use expectancy for planning, because it scales with trade frequency. Use profit factor for comparing strategies of different sizes.
What Is a Good Profit Factor?
There is no universal threshold that establishes quality. Above 1.0 means gains exceeded losses on the stated cost basis. Assess costs, sample size, outliers, drawdown, and performance on unseen data. Trade frequency alone cannot establish whether a profit factor of 1.15 is viable.
A figure above 3.0 deserves inspection, but is neither proof of quality nor proof of a flawed test. Check whether a few winners dominate, whether costs are included, and whether results hold across different periods.
Is Profit Factor the Same as Risk-Reward Ratio?
No. Risk-reward ratio describes a single planned trade: the distance to your target divided by the distance to your stop. Profit factor describes realised results across many trades and already contains your win rate. A strategy can plan a 1:3 risk-reward ratio on every trade and still produce a profit factor below 1.0 if it wins rarely enough.
Expectancy Compared With Win Rate, Risk-Reward and Profit Factor
Each metric answers a different question. So reading them together prevents the errors that any one of them invites.
| Metric | What it answers | Main blind spot |
|---|---|---|
| Win rate | How often do I win? | Ignores size entirely |
| Risk-reward ratio | How much do I plan to make per unit risked? | Planned, not realised; ignores win rate |
| Profit factor | How much did I earn per unit lost? | Dimensionless; hides trade frequency |
| Expectancy | What is my average result per trade? | Hides the losing runs inside the average |
| Maximum drawdown | What was the worst peak-to-trough fall? | Says nothing about the edge itself |
The last row matters most for funded-account traders, and it leads to the section below.
Why Positive Expectancy Can Still Fail a Prop Firm Challenge
An average describes the destination. Prop firm rules constrain the path. A strategy with genuine positive expectancy can still breach a daily loss limit or a maximum drawdown rule during a normal losing run.
Return to example one, the strategy with a 35 per cent win rate and positive expectancy. Losing runs are not a risk in that strategy; they are a feature of it. Assume 100 independent trades with a constant 65 per cent loss probability and no breakeven outcome:
| Losing run | Probability of occurring at least once |
|---|---|
| 5 or more consecutive losses | 99.5 per cent |
| 6 or more | 95.7 per cent |
| 8 or more | 69.0 per cent |
| 10 or more | 36.8 per cent |
| 12 or more | 16.9 per cent |
These exact run probabilities track the order of losses, unlike a binomial distribution that counts total losses. The model does not fix the total at exactly 65 losses. Its mean longest losing run is 9.12 trades. Actual trades may be correlated, probabilities can change, and a historical win rate is an estimate. These are model illustrations, not forecasts or account-breach probabilities.
Even a coin-flip strategy runs hot and cold. Under the same independence assumption, at a constant 50 per cent win probability, six or more consecutive losses appear in about 55 per cent of 100-trade samples.
So the practical question is not whether your expectancy is positive. It is whether your position size lets a normal losing run finish without breaching a limit. Three losses each equal to 2 per cent of a fixed starting balance total 6 per cent before additional costs. At 0.5 per cent of that same balance, three losses total 1.5 per cent. Whether either sequence breaches a rule depends on the remaining allowance, other positions, costs, and the programme’s calculation method.
Our guides to position sizing for prop firms, prop firm drawdown rules, and the 3-5-7 risk rule cover how to size around these constraints. Requirements vary by programme and account type, so confirm the current rules for your specific programme before starting a challenge.
How to Track Expectancy by Setup, Session and Instrument
A single account-wide trading expectancy figure averages away the information you need. So segment it instead.
Tag every closed trade with the setup name, the session, the instrument, and the holding period. Then calculate trading expectancy within each tag. Most traders discover a wide spread: one or two segments carry the account, and several drag on it.
| Segment | Why it separates results |
|---|---|
| Setup | Different logic, different edge; some setups never had one |
| Session | Liquidity and spread change through the day |
| Instrument | Costs and volatility differ sharply between markets |
| Holding period | Swap and overnight risk apply only past a point |
Two cautions apply. First, segmenting splits your sample, so each segment needs enough trades to mean anything. Second, resist cutting a segment after a short losing run. That is exactly what a normal losing streak looks like from the inside.
This is where a trading journal earns its keep, and where backtesting in Trader’s Gym can extend a thin sample using historical data.

Frequently Asked Questions
What is trading expectancy?
Trading expectancy is the average gain or loss per trade across a sample, calculated as (win rate x average win) minus (loss rate x average loss). It combines how often a strategy wins with how much it wins and loses. Positive expectancy means the strategy produced a net gain historically after costs.
How do I calculate trading expectancy?
Export your closed trades, use final net results, and subtract only costs not already included. Then split them into winners and losers. Divide winners by total trades for your win rate, and average each group separately. Apply the formula: (win rate x average win) minus (loss rate x average loss). Count breakeven trades in the total with a value of zero.
What is profit factor in trading?
Profit factor is gross profit divided by gross loss across a set of trades. A profit factor of 1.5 means the strategy earned 1.50 for every 1.00 lost. Below 1.0 the strategy lost money over that sample. It measures realised efficiency rather than any single trade’s planned outcome.
What is a good profit factor?
No universal threshold establishes quality. Assess costs, sample size, outliers, drawdown, and performance on unseen data. Trade frequency or a high profit factor alone does not establish robustness.
Is profit factor the same as risk-reward ratio?
No. Risk-reward ratio describes one planned trade, comparing target distance with stop distance. Profit factor describes realised results across many trades and already accounts for win rate. A strategy planning a 1:3 risk-reward ratio can still produce a profit factor below 1.0 if it wins too rarely.
Can a strategy have a high win rate and lose money?
Yes. Take a strategy winning 80 per cent of trades, with an average win of 100 and an average loss of 500. Its expectancy is minus 20 per trade. Win rate describes frequency only. Without the average sizes attached, it says nothing about whether a strategy makes or loses money.
How many trades do I need for expectancy to be meaningful?
There is no universal number. Expectancy stabilises as the sample grows, and how fast depends on the variability of your results and how many market conditions the sample covers. A high-frequency strategy reaches a useful sample quickly, whereas a swing strategy may need years of trades to cover comparable conditions.
Does positive expectancy mean I will pass a prop firm challenge?
No. Expectancy describes an average, while prop firm rules constrain the path taken to reach it. Normal losing runs can breach a daily loss limit or maximum drawdown rule even when the underlying edge is real. Position sizing, not average return, decides whether a strategy survives those limits.
Disclaimer
This article is for educational purposes only. It does not constitute financial, investment, or trading advice, and no part of it should be taken as a recommendation to adopt any strategy or trade any instrument.
CFDs are complex instruments and come with a high risk of losing money rapidly due to leverage. Scalping and day trading both increase exposure through frequent trading and reliance on stop-losses. You should consider whether you understand how these products work and whether you can afford to take the high risk of losing your money.
ThinkCapital provides access to accounts that operate in a simulated trading environment using virtual capital. ThinkCapital does not offer brokerage services and does not accept deposits as investments. References to trading strategies describe general market mechanics and are not instructions to trade.