If you’ve ever stared at a price chart wondering why the RSI indicator signaled a reversal that never happened, you aren’t alone.
Key Takeaways:
- Best Setting: The 14-period RSI is the industry standard for prop trading.
- Primary Use: Identify momentum exhaustion, not just overbought/oversold levels.
- Top Strategy: Trade RSI Divergence and Failure Swings for high-probability reversals.
- Golden Rule: Never trade RSI in isolation; combine it with price structures like support/resistance.
Most traders slap the Relative Strength Index (RSI) on their screen, wait for it to cross 70, and hit sell. Then they watch in horror as the bullish trend rips higher, taking their account with it.
Here is the truth: The RSI indicator is one of the most powerful tools in technical analysis, but 90% of traders use it wrong.
When you are trading a funded account with ThinkCapital, you can’t afford to guess. You need a trading strategy that relies on data, not luck.
In this guide, we’ll strip away the noise. We’ll cover what the RSI actually tells you about price momentum, the best RSI settings for prop trading, and how to spot high-probability reversals using divergence and failure swings.
What Is the RSI Indicator?
The Relative Strength Index (RSI) is a momentum oscillator that measures the speed and change of price movements on a scale from 0 to 100. Developed by J. Welles Wilder, it is the primary tool traders use to identify overbought or oversold conditions in the market.
Read More: Master the Basics in our Prop Trading Fundamentals Guide
Think of it like the speedometer in your car. It doesn’t tell you where the market is going, but it tells you how fast it’s getting there.
- RSI rises when the average price gains (based on closing prices) are stronger than the losses.
- RSI falls when the average loss exceeds the average gain.
Traders use these RSI values to determine if a particular asset in the financial markets is “overheated” (overbought) or “oversold.” But as we’ll see, these terms are often misleading.
Overbought and Oversold Conditions: The Trap
Traditionally, technical trading systems teach a simple rule:
- Overbought territory: RSI above 70 (Sell signal).
- Oversold territory: RSI below 30 (Buy signal).
In a ranging market, this works beautifully. But in a strong chart trend, it’s a disaster.
During a strong uptrend, the RSI can stay in overbought territory for weeks. If you sell just because the RSI hit 72, you are standing in front of a freight train. The same applies to a strong downtrend—the RSI can hug the oversold levels while prices continue to crash.
Pro Tip: Overbought or oversold conditions are not immediate signals to reverse. They are alerts to pay attention. We need confirmation from price action before we make a move.
Best RSI Indicator Settings for Prop Trading
Most trading platforms default to an RSI calculation over 14 periods.
Should you change it? For most RSI strategies, no.
The 14-period RSI is the standard for a reason. It offers a balance between sensitivity and reliability.
- Lower Breakdown (e.g., RSI 7): Reacts faster to recent price changes but produces many false signals.
- Higher Breakdown (e.g., RSI 21): Smoother line, but you might miss the initial reaction of the move.
If you are defining your trading style for a ThinkCapital challenge, it might be better to stick to the standard 14. Consistency allows you to judge past performance accurately.
The Secret Weapon: RSI Divergence
If you only learn one thing about this indicator, make it RSI divergence.
Divergence occurs when the price momentum disagrees with the price chart. It suggests that the current trend is losing steam and a reversal might be near.
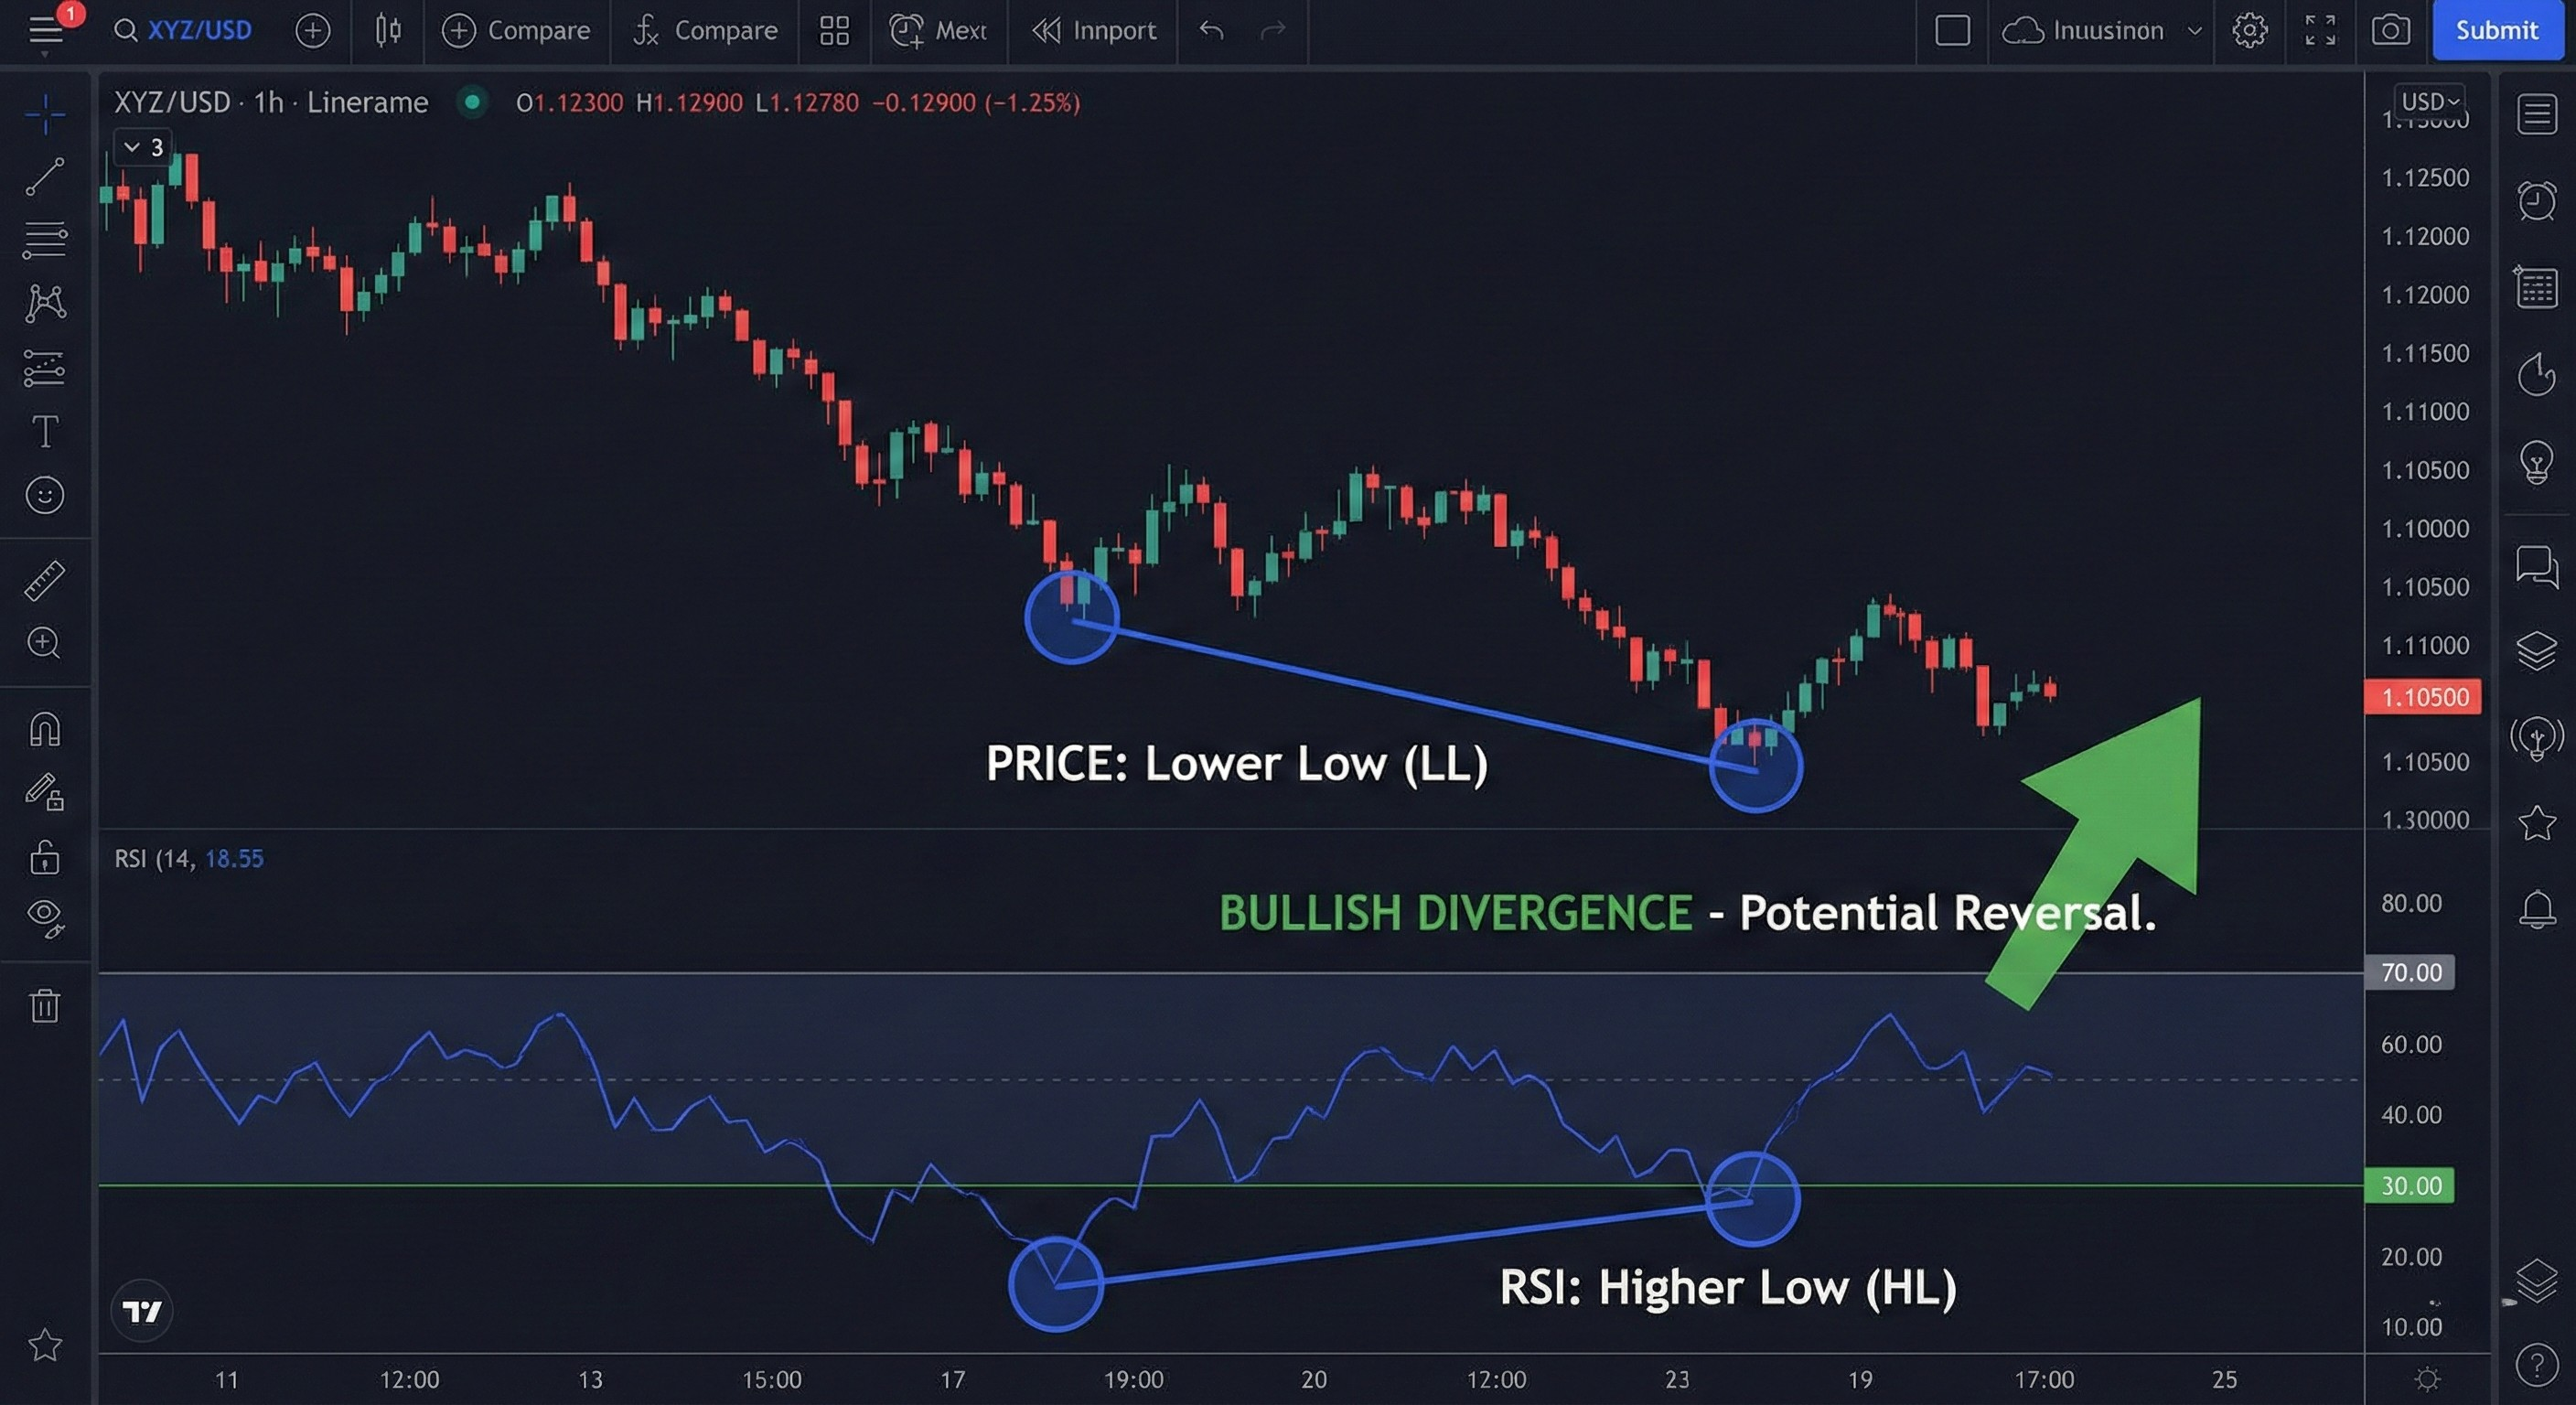
Bullish Divergence
This happens in a bear market or downtrend.
- Price: Makes a lower low.
- RSI: Makes a higher low.
This tells you that while sellers are still pushing price falls, the downside momentum is drying up. It’s a strong signal to look for long entries.
Bearish Divergence
This happens in a bull market or uptrend.
- Price: Makes a higher high.
- RSI: Makes a lower high.
The buyers are exhausted. Even though price is rising, the “gas in the tank” (momentum) is empty. We look for sell signals here.
Why this matters: Bearish and bullish divergences help you identify potential reversals before they happen on the chart.
Advanced Strategy: RSI Failure Swings
Wilder himself considered failure swings to be stronger signals than standard divergences. These setups ignore price completely and focus only on RSI behavior.
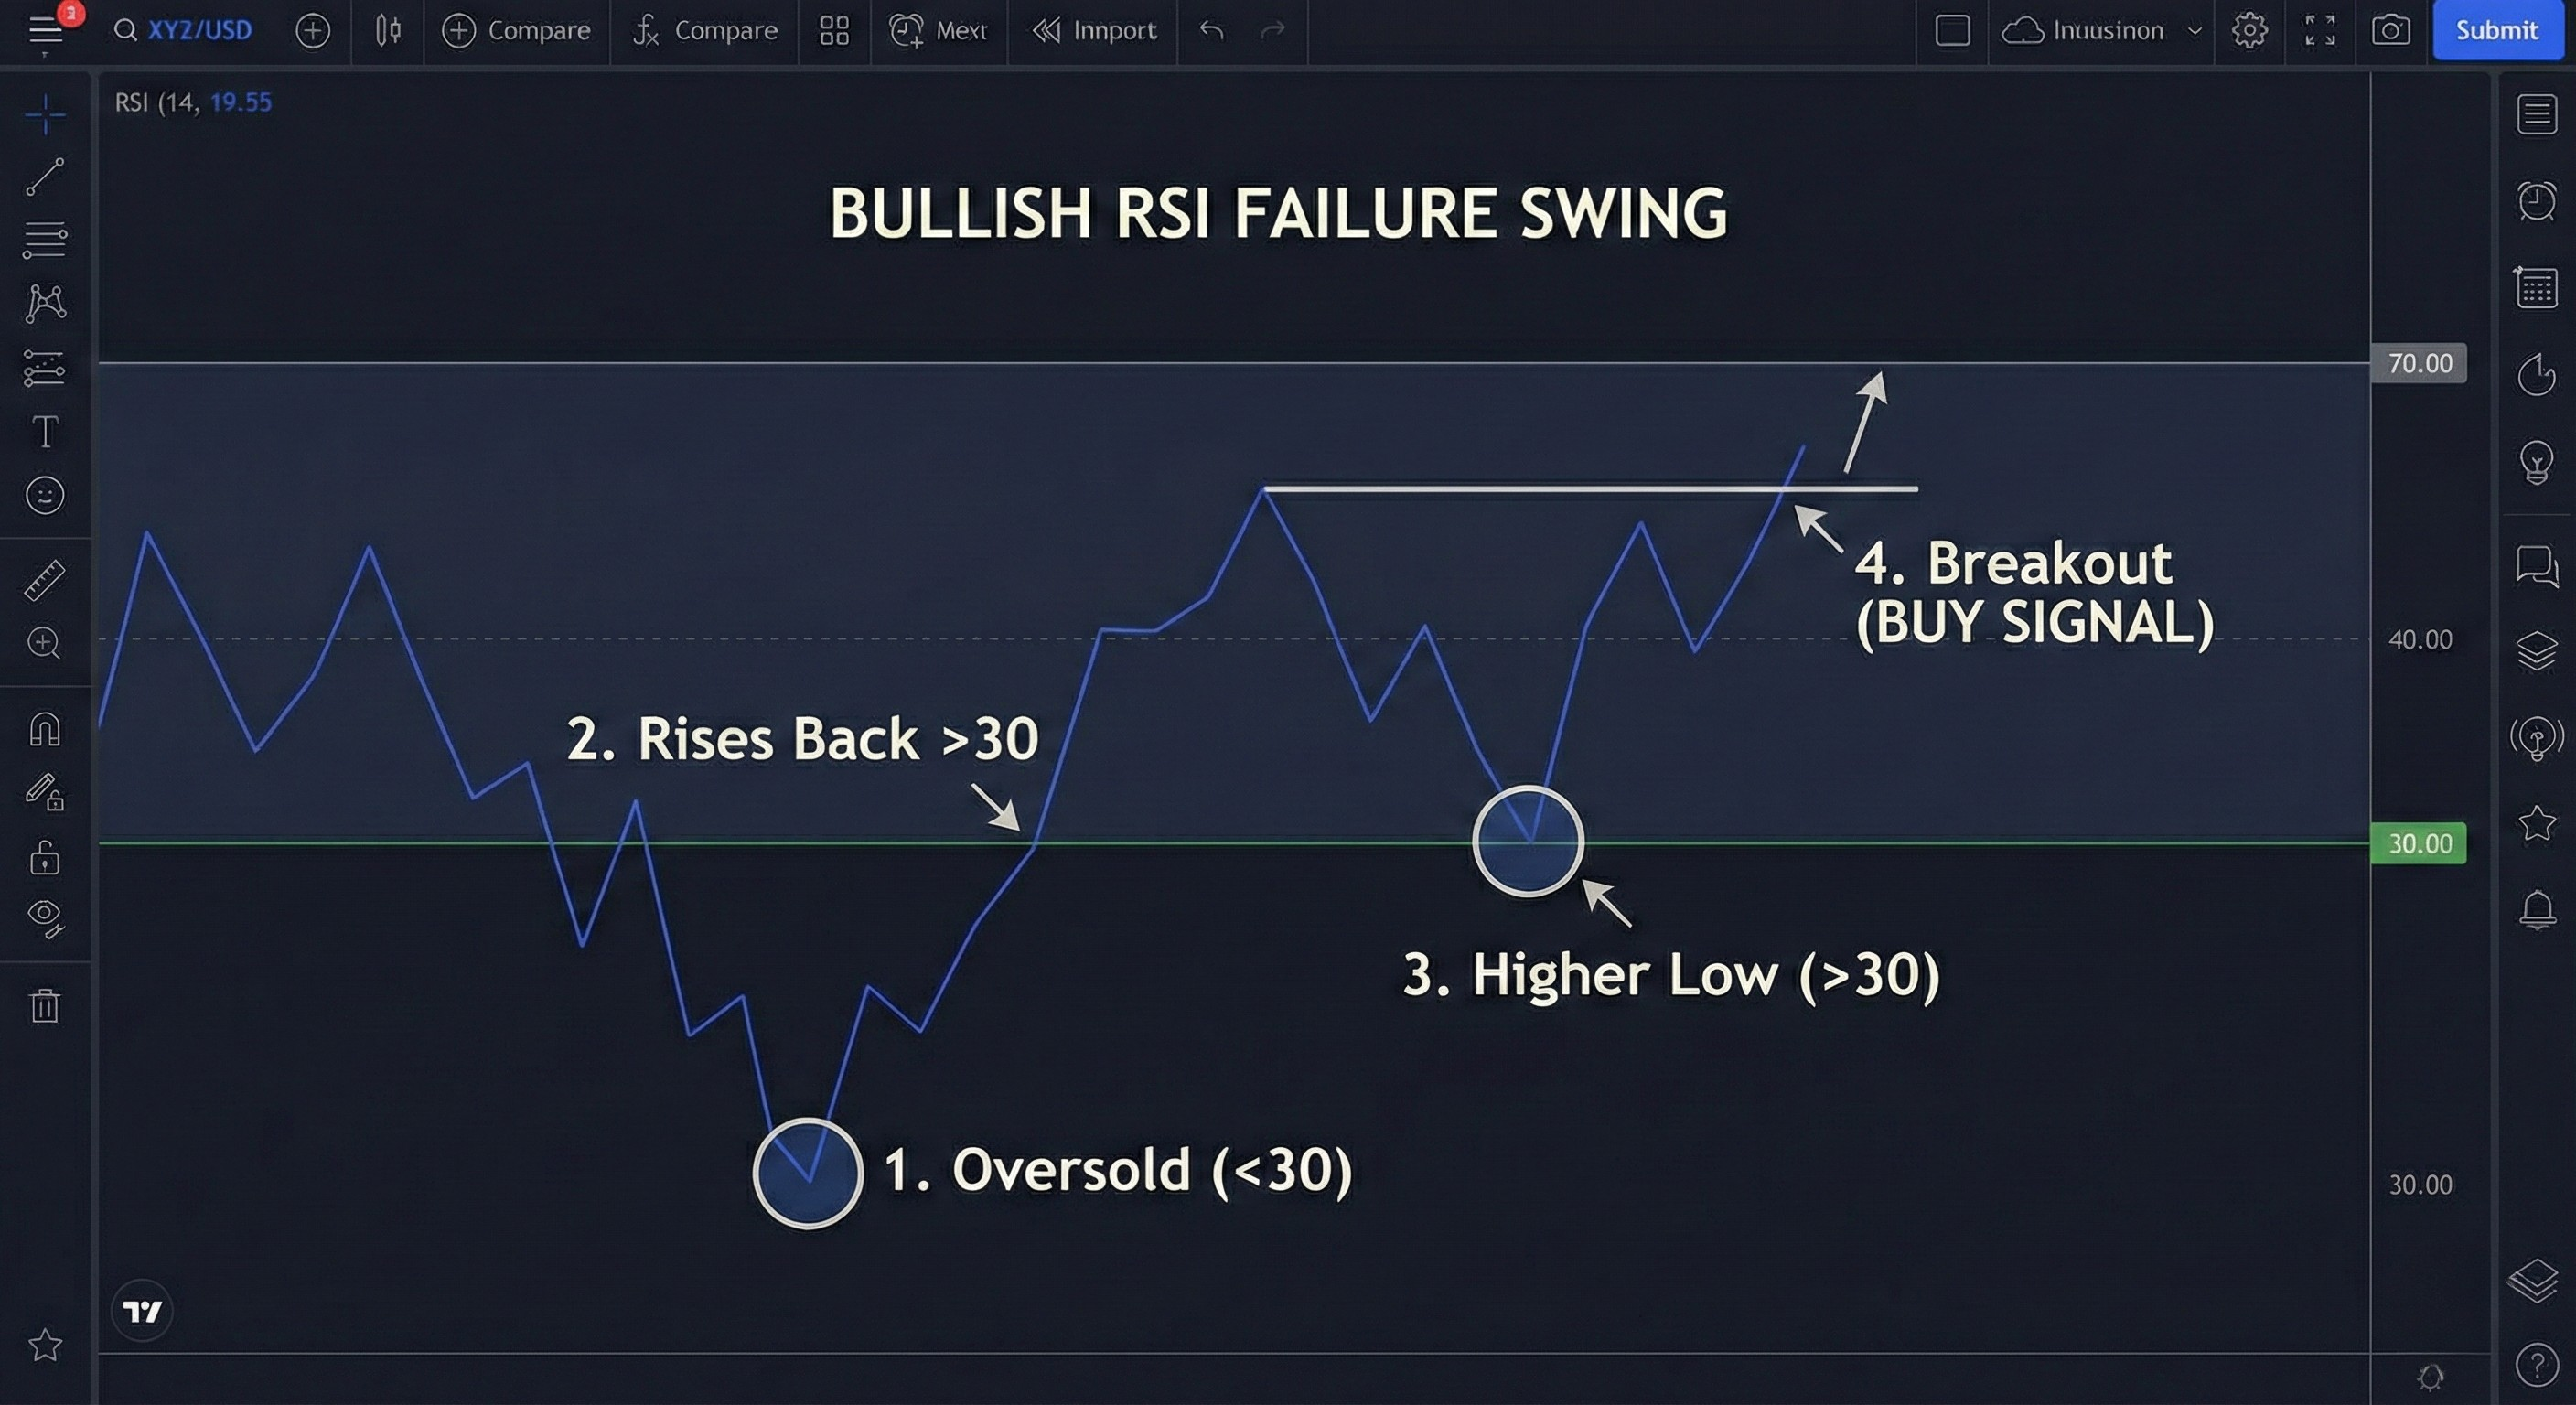
Bullish Failure Swing (Buy Signal)
- RSI drops into oversold territory (below 30).
- RSI rises back above 30.
- RSI pulls back but holds above 30 (creating a higher low).
- RSI breaks above its previous high.
Bearish Failure Swing (Sell Signal)
- RSI pushes into overbought territory (above 70).
- RSI drops below 70.
- RSI rallies but fails to cross 70 (creating a lower high).
- RSI breaks below its recent low.
This pattern confirms that momentum has shifted. It filters out many of the false signals you get from simple overbought readings.
Combining RSI Indicator with Other Tools
No single indicator is a magic bullet. To reduce false signals, smart traders combine RSI with market structure.
- Support and Resistance Levels: Only take a bullish divergence signal if price is reacting off a key support zone.
- Moving Averages: Use the 200 EMA to identify the trend. In a bullish trend, ignore overbought signals and look for oversold dips to buy.
By strictly filtering your trades, you protect your capital, the most critical skill in passing a prop challenge.
Frequently Asked Questions
Q: What is a good RSI indicator?
A: The standard 14-period Relative Strength Index is the most reliable option for most traders. It effectively balances sensitivity with noise reduction across various market conditions.
Q: Is RSI above 70 buy or sell?
A: Generally, RSI above 70 is a signal to look for a sell, but not to enter immediately. In strong trends, price can continue rising even with overbought readings. Wait for a structural break or divergence.
Q: How to use RSI as an indicator?
A: Use RSI to gauge momentum and spot exhaustion. Do not use it as a standalone trigger. Combine RSI ranges with price action and key market levels for high probability setups.
Q: Is RSI below 30 a buy signal?
A: RSI below 30 indicates oversold conditions, but price can go lower. It becomes a buy signal only when you see bullish divergence or a failure swing confirming that buying momentum is returning.
Q: What is the RSI formula?
A: The RSI formula calculates the ratio of upward-to-downward movement. While you don’t need to do the math yourself, knowing it helps you understand why the indicator reacts to past performance in price.
—
Ready to Test Your Strategy? Theory is good, but execution is everything. Put your RSI strategies to the test on a ThinkCapital Evaluation. Prove your skills, manage your risk tolerance, and earn a funded account with up to 90% profit split.

Disclaimer
This content is provided for educational purposes only and should not be interpreted as financial or investment advice. Trading in forex, stocks, or any other financial markets involves significant risk. You may lose more than your initial investment, and past performance does not guarantee future results.
Always consider your personal financial situation, level of experience, and risk tolerance before trading. If necessary, consult with a licensed financial advisor or qualified professional. Any strategies, tools, or examples mentioned are for illustration only and do not represent a complete guide.