For traders looking to build a consistent edge, mastering technical analysis is non-negotiable. One of the most recognizable and widely used chart patterns is the hammer candlestick pattern.
Whether you are scanning a daily chart, a weekly chart, or an intraday 15-minute timeframe, seeing a hammer candle forming can provide early clues that a downward trend is exhausting itself. But as with all technical analysis tools, you must learn how to interpret the market context properly.
This comprehensive guide breaks down exactly what the bullish hammer candlestick pattern is, how to identify it, and how to combine it with other technical indicators to reduce false signals and build a disciplined strategy.
Key Takeaways
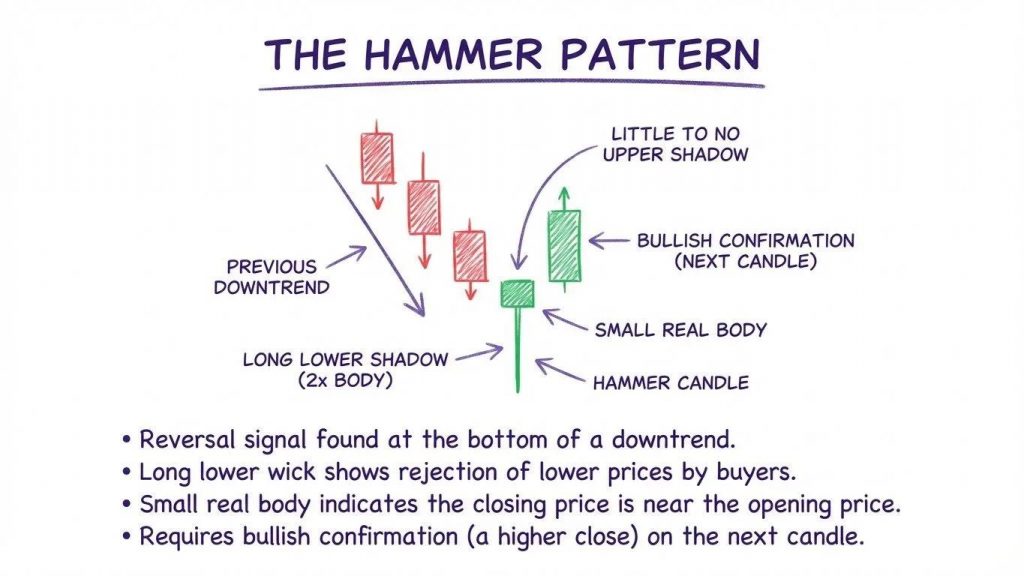
- Bullish Reversal Signal: A hammer candlestick typically forms at the bottom of a sustained decline, acting as an early reversal signal that heavy selling pressure or downward momentum is fading.
- Physical Anatomy: It features a small body containing the opening and closing prices, and a long lower shadow (wick) that is at least twice the length of the real body. It should have little to no upper shadow.
- Context is Critical: A hammer is most meaningful after a clear price decline or pullback into support. A hammer forming at the top of an uptrend is a different pattern altogether.
- Confirmation Required: A potential bullish reversal is not guaranteed. A common confirmation method is for the next candle to break or close above the hammer’s high.
What Is the Hammer Candlestick Pattern?
The bullish hammer pattern is a single-candle indicator. It visually represents a dramatic shift in market sentiment, illustrating a session where sellers pushed prices lower, but buyers regained control to close the session near its high.
Anatomy of a Hammer Candle
To correctly identify a bullish candlestick like the hammer, look for these characteristics:
- Small Real Body: The opening price and closing price are tightly clustered near the top of the trading range. While a red hammer candlestick is valid, a green bullish hammer (where the close is higher than the open) represents a stronger bullish signal.
- Long Lower Shadow: This is the defining feature. The lower shadow must be substantially long, showing the extreme depths sellers attempted to reach.
- Little to No Upper Shadow: There should be almost no long upper shadow extending above the real body.
Where the Hammer Appears: Context Matters
A hammer pattern’s location on the chart defines its meaning.
- A hammer is most meaningful after a clear downtrend or pullback into support: If a hammer forms during sideways consolidation, its reversal significance is usually weaker unless it appears at a clear support level.
- Check Volume: It is more reliable when accompanied by increased trading volume or higher than average volume. Higher-than-average volume can strengthen the signal by showing stronger market participation.
- Avoid isolation: The most reliable hammer formations establish a potential bullish reversal directly upon major support and resistance levels or trend lines.
Hammer vs Hanging Man Candlestick Pattern
The hammer and the hanging man candlestick pattern share the same physical structure: a small real body at the top of the range and a long lower wick. The only difference is the preceding trend.
So what’s the difference?
The distinction lies entirely in the preceding market trend.
How to tell them apart:
- Hammer: Forms after price falls significantly. It signals that buyers absorbed the selling pressure, indicating a bullish reversal.
- Hanging Man: This hanging man pattern forms at the top of an uptrend. Despite looking like a hammer, the hanging man is actually a bearish signal, warning of a potential bearish reversal because the sudden presence of a long lower wick shows sellers are starting to test the buyers.

Psychology Behind the Hammer Candle
Every candlestick pattern tells a story about order flow. When a hammer forms amid bearish momentum, here is the psychology:
- The Open: Sellers are firmly in control, driving prices down efficiently.
- The Test: The price reaches the hammer’s low, where buying pressure suddenly surges. Limit orders are triggered at historical support zones.
- The Close: Buying pressure absorbs the selloff and pushes price back toward the session high, rapidly pushing the price back up to close near the open. This aggressive rejection creates a surge of bullish momentum.
Variations of the Hammer Pattern
While the standard hammer is popular, there are related trading patterns to study.
Inverted Hammer
An inverted hammer forms at the bottom of a downtrend and features a small body at the bottom with a long upper wick. Note that if this same shape appears at the peak of an uptrend, it is called a Shooting Star and is a bearish signal. It indicates that buyers attempted to push the price higher before sellers pushed it back down. Still, this initial surge warns that the price decline may be ending.
Dragonfly Doji
A Dragonfly Doji occurs when the open, high, and close are all at the session high. This creates a ‘T’ shape with a long lower shadow and no upper wick, signaling a potential reversal. This forms a cross or ‘T’ shape. It can act as a bullish reversal signal when it appears after a decline and receives confirmation.
How to Trade the Hammer Candlestick Pattern
Professional traders test their trading strategies meticulously. You do not just open a long position every time a hammer prints.
- Identify the Drawdown: Ensure the market has established clear lower lows.
- Locate Support: Combine the hammer with other technical analysis tools like Fibonacci levels or major Moving Averages.
- Wait for a Confirmation Candle: Do not jump in the second the hammer closes. When trading hammer patterns, a conservative approach is to wait for the next candle to close higher before entering a long position. A common confirmation method is for the next candle to break or close above the hammer’s high, especially if accompanied by increased trading volume.
- Define Risk: A strict stop-loss should be placed just below the hammer’s low. Define logical profit targets at the next tier of resistance levels. Using a fixed reward-to-risk ratio, such as 2:1 or 3:1, can help in setting profit targets when trading hammer patterns.
Advanced Tip: Multi-Timeframe Analysis and Oscillators
A hammer candlestick pattern can appear on any timeframe, but it is generally more reliable when it appears at a significant support level on higher timeframes like a daily chart or weekly chart. Multi-timeframe analysis can improve the effectiveness of hammer patterns by confirming overarching trends. Furthermore, combining hammer patterns with oscillators like RSI can provide stronger bullish signals when oversold conditions are present.
Example Chart Setup Using Hammer Candles
Micro E-mini S&P 500 (MES)
Index markets often exhibit V-shaped recoveries. Imagine the MES has dropped steadily. It hits a major psychological support level (e.g., 5,000). A 15-minute candle spikes down to 4,990, but heavy volume immediately drives it back to close at 4,998. This textbook hammer candle offers a clearly defined risk level for a potential entry.
Platforms and Tools to Spot Hammer Patterns
Successful pattern recognition requires pristine charting software.
Using ThinkTrader and TradingView
ThinkCapital provides access to ThinkTrader and direct integration with TradingView. These platforms offer advanced candlestick charting and alerts, allowing you to instantly spot when a bullish hammer candlestick pattern signals an entry.
Practice with Simulated Account Evaluations
To master candlestick patterns safely, ThinkCapital offers evaluation challenges. You can test your strategy dealing with false signals in a simulated environment with deep liquidity without risking personal funds.

Pros and Cons of Trading the Hammer
Pros:
- Easy to Identify: Its visual structure stands out vividly on a chart.
- Risk Definition: The low of the wick provides an exact, undeniable stop-loss level.
- Early Entry: It often prints exactly at the turning point of a major swing.
Cons:
- False Signals: In an aggressive downtrend, a hammer can just be a brief pause.
- Requires Context: Using it in isolation tends to produce weaker results and more false signals.
Conclusion
The hammer candlestick pattern is a foundational pillar of technical analysis that can be applied across various asset classes, including stocks, forex, and commodities, to identify potential trend reversals. It tells a compelling story of early seller dominance followed by absolute buyer rejection. However, to utilize it effectively, especially when protecting a simulated prop firm account, traders should always consider the broader market context and trend. Traders should maintain emotional discipline and follow a robust risk management plan, as no single pattern guarantees a successful trade.
Ready to apply what you’ve learned?
Understanding patterns like the hammer is one thing. Executing them with consistency is what separates traders who improve from those who stay stuck.
ThinkCapital gives you a structured environment to do exactly that.
Test your strategy, manage risk, and build consistency through a simulated trading evaluation designed to mirror real market conditions.
No shortcuts. Just a clear process and measurable performance.
👉 Start Your ThinkCapital Challenge Today
FAQs
Q: What does a hammer candlestick pattern indicate?
A: A hammer candlestick pattern indicates a potential bullish reversal. It shows that sellers initially drove prices down, but buyers overwhelmed them to close the session near its high, signaling that the downward trend may be exhausted.
Q: Is the hammer candlestick pattern bullish or bearish?
A: The hammer pattern is bullish. It signals that downward momentum may be ending and a price reversal to the upside could follow.
Q: How do you confirm a hammer candlestick pattern?
A: A common way to confirm a hammer is for the next candle to close above the hammer’s high, ideally with increased trading volume.
Q: Can a red hammer candlestick still be bullish?
A: Yes. While a green hammer (where the close is higher than the open) is a stronger bullish signal, a red hammer still indicates that buyers forcefully rejected the extreme lows of the session.
Q: What is the difference between a hammer and a hanging man?
A: They have the exact same shape. The difference is the market context: a hammer forms after a downtrend (signaling a bullish reversal), while a hanging man forms at the top of an uptrend (signaling a bearish reversal).
Q: What timeframe is best for trading hammer candlestick patterns?
A: While hammers can appear on any timeframe, they are generally much more reliable on higher timeframes like the daily chart or weekly chart because those levels represent significant institutional order flow.
Q: Does the hammer candlestick pattern work in futures trading?
A: Yes, it can be effective in futures trading (like the E-mini S&P 500 or NQ), especially when the pattern aligns with major psychological support levels or high-volume nodes.
Q: How accurate is the hammer candlestick pattern?
A: No pattern is 100% accurate. The hammer is most reliable when combined with other technical indicators, support zones, and strict risk management, as false signals frequently occur in strong, sustained downtrends.
Disclaimer
Trading involves significant risk and may not be suitable for all individuals. The funded accounts referenced are simulated accounts, and traders do not trade with real capital. Profit withdrawals are based on simulated trading performance, and no profits are guaranteed. The evaluation fee is a cost for the opportunity to demonstrate trading skills and does not represent a deposit into a live brokerage account.
This content is provided for educational purposes only and should not be considered financial or investment advice. Trading in forex, stocks, or other financial markets carries the risk of substantial loss, including the potential to lose more than your initial investment. Past performance does not guarantee future results.
Always consider your personal financial situation, level of experience, and risk tolerance before trading. If needed, consult a licensed financial advisor or qualified professional. Any strategies, tools, or examples mentioned are for illustrative purposes only and do not represent a complete or guaranteed approach.