Have you ever looked at a chart and felt a sense of déjà vu? That feeling that the market is repeating itself in some way? This happens because certain movements and formations keep showing up on price charts. Learning to identify and trade chart patterns is a core skill for any trader, offering a visual way to understand market psychology and predict potential price action. This guide covers the most used patterns, how to validate them, and practical ways to trade or ignore them.
What Are Chart Patterns in Trading?
A chart pattern is a recognizable formation on a price chart created by an asset’s price movements. Traders use these patterns as a core part of technical analysis because they tend to repeat across stock charts, bar charts, and trading charts. When a specific price pattern forms, it often signals one of two things: the market may continue in the same direction (a continuation pattern) or it may shift into the opposite direction (a reversal pattern). The prior trend is a critical component of every pattern’s definition. A reversal pattern only signals a potential reversal when it appears after a prolonged trend, while a continuation pattern signals a pause before the trend resumes.
What makes chart patterns useful isn’t just the shape itself, but the insight into trader behavior—when buyers push against a resistance line, or when sellers defend a support level. By learning to recognize these setups, you can build a structured trading strategy instead of trading on guesswork.
Types of Chart Patterns
There are many different chart patterns, but they generally fall into one of three categories: reversal, continuation, or bilateral patterns. Reversal patterns signal a potential change in the prevailing trend. Continuation patterns point to a trend resuming. Bilateral patterns can break in either direction with no built-in bias, though many still carry a statistical directional tendency.
Reversal Patterns
Reversal patterns signal a potential change in the prevailing trend. When one of these patterns appears after a prolonged trend, it suggests that the market is about to reverse course.
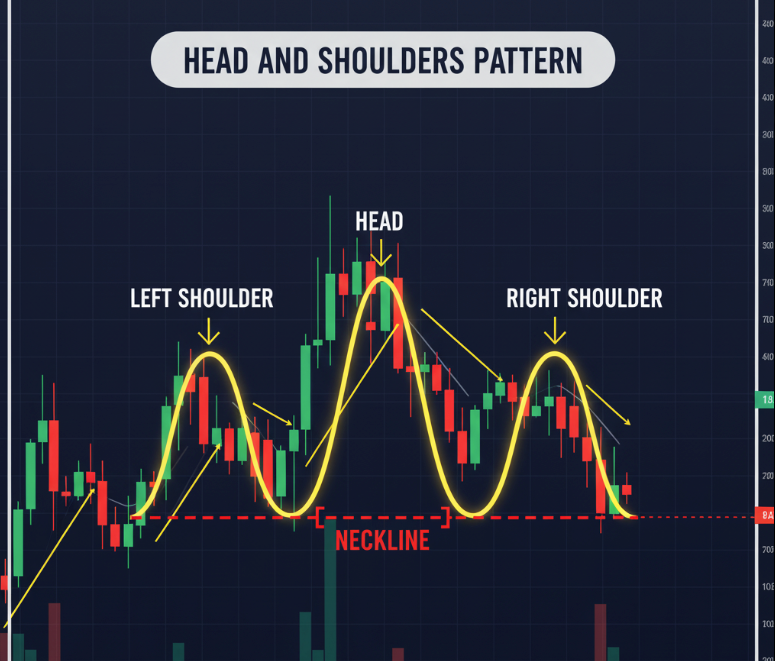
A classic example is the head and shoulders pattern. It’s a bearish reversal pattern that forms after an uptrend. The pattern has a central peak (head) flanked by two lower peaks (shoulders). A head and shoulders pattern suggests that buying pressure is weakening. Conversely, the inverse head and shoulders is a bullish reversal pattern that forms after a downtrend, featuring a central trough flanked by two higher troughs.

Another common example is the double top and double bottom patterns. A double top pattern is a bearish pattern that forms after two failed attempts to break a key resistance level. The double top is made of two peaks with a valley in between, which is called the neckline. When the price breaks below this neckline, it’s a signal of a potential trend reversal. Conversely, a double bottom is a bullish reversal that signals a potential uptrend, forming a “W” shape. The triple top/bottom patterns are similar but with three consecutive peaks or troughs, and are generally considered more reliable.
Continuation Patterns
Continuation patterns suggest that the ongoing trend will continue. These patterns typically develop during a pause in the market, as traders take a break before the trend resumes.
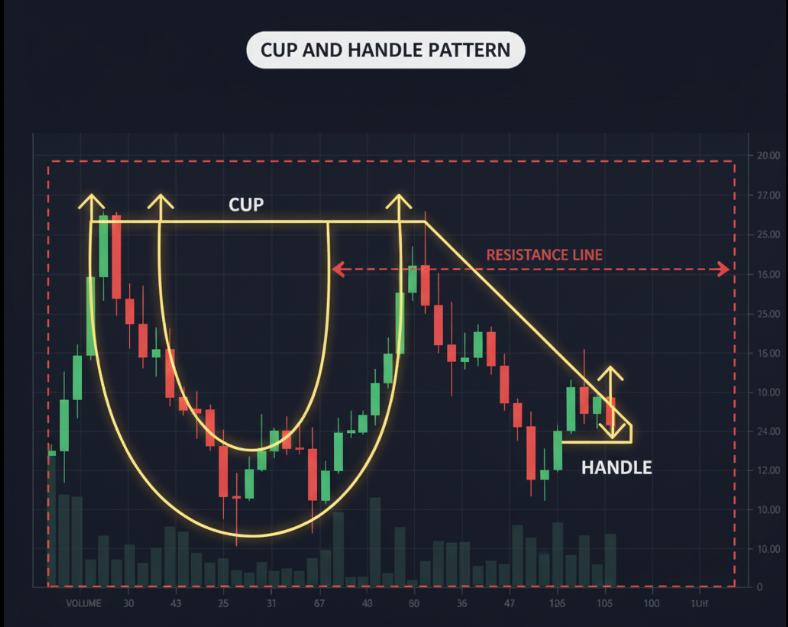
One of the most well-known is the cup and handle pattern. This is most often traded as a bullish continuation in an uptrend, shaped like a “U” (the cup) followed by a slight downward drift (the handle). When the price breaks out of the handle, it signals that the upward trend will continue. At times it can also act as a base pattern after a longer decline. The inverted cup and handle pattern suggests a bearish reversal and can be traded in an identical manner but in reverse. It forms after an uptrend, with the breakout from the handle signalling a new downtrend.

The bullish flag pattern is another great example. This continuation chart pattern forms after a strong price move (the flagpole), followed by a brief, slanted consolidation (the flag). When the price breaks out of the flag in the same direction as the flagpole, it confirms the ongoing trend. Pennants are classic continuation patterns after a strong impulse. Rectangles, however, are neutral trading ranges until a breakout occurs—the breakout direction, combined with the prior trend, determines whether continuation is confirmed.
Bilateral Patterns
Bilateral patterns can signal either a continuation or a reversal, depending on the direction of the price breaks. These patterns are often associated with periods of market indecision.
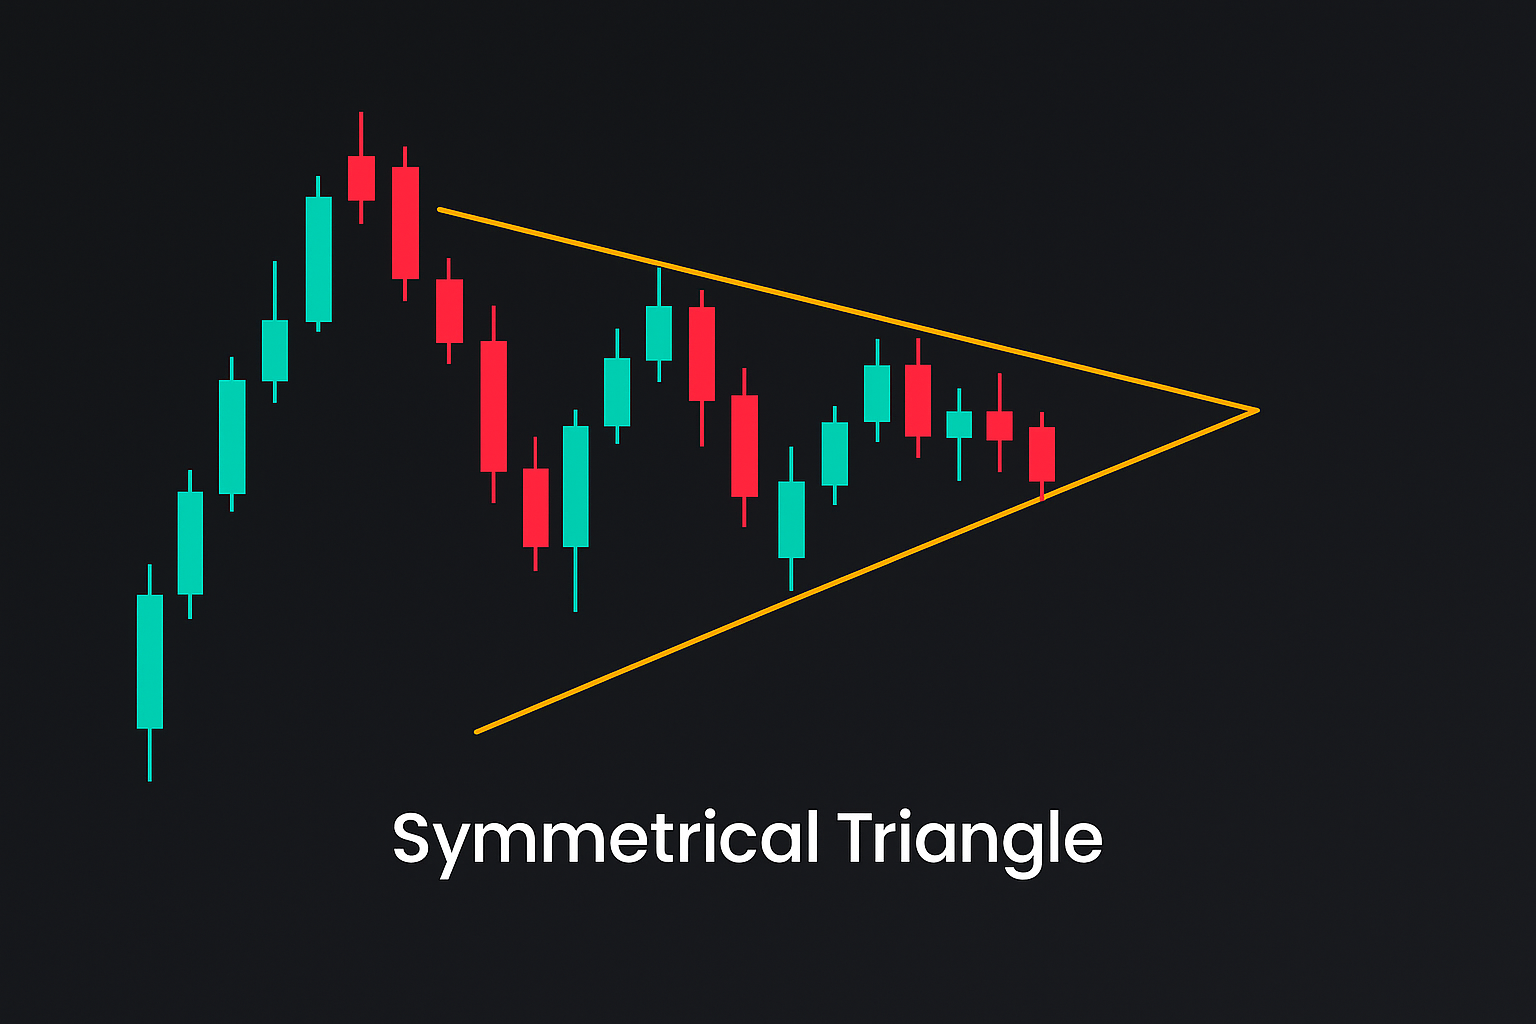
The symmetrical triangle pattern is a perfect example. A symmetrical triangle is a triangle pattern where the price is consolidating between two converging trend lines. While often considered neutral, it statistically has a continuation bias, breaking in the direction of the prior trend more often than not. Traders should still treat it as a bilateral pattern and wait for confirmation of a breakout. The rising wedge chart pattern typically has a bearish bias and often leads to a downside break, while the falling wedge chart pattern usually carries a bullish bias and signals an upside break. Both wedge patterns can act as either continuation or reversal depending on the prior trend, but unlike symmetrical triangle chart patterns they are not truly neutral. For example, a rising wedge in an uptrend is typically a bearish reversal, whereas a rising wedge in a downtrend is a bearish continuation. The same logic applies to a falling wedge: it’s a bullish reversal in a downtrend and a bullish continuation in an uptrend.

How to Trade Chart Patterns
Using trading chart patterns is all about identifying a pattern and acting on it. Here’s a simple process to follow:
- Identify patterns: Look for specific price patterns on your charts. For day traders, this might mean using shorter time frames. For example, a descending triangle pattern signals that sellers are in control, as the price makes lower highs against a horizontal support level. This pattern is a classic bearish continuation pattern, though it can occasionally fail and act as a reversal.
- Wait for confirmation: Don’t trade a pattern until you have confirmation. In practice, this usually means waiting for a decisive close beyond the support or resistance level, ideally with above-average volume or momentum confirmation. For example, with a falling wedge pattern, you would wait for the price to close above the falling resistance line before entering a trade.
- Set your profit target and stop loss: Once you’ve entered a trade, you need a plan. A profit target is often determined by the size of the pattern itself. For example, the distance from the high point to the low point of a head and shoulders pattern can be used to project the potential drop. A stop loss is just as important, as it protects you from a pattern failure. For flags and pennants, a common price target is the length of the flagpole projected from the breakout. For triangles, traders often measure the widest part of the triangle and project that distance from the breakout point. Always pair profit targets with stops placed just inside the pattern.
Best Chart Patterns for Trading
While there are many common chart patterns, some are easier for beginners to identify and trade. Simple setups like the double top and double bottom are great starting points. The flag pattern and pennant are also straightforward to use, as they clearly signal a continuation of the ongoing trend. The falling wedge is a great bullish reversal pattern for beginners, especially after a downtrend, though it can also act as a continuation pattern in a strong uptrend. Its clear structure makes it one of the easier patterns for beginners to trade.
Advanced Chart Patterns for Experienced Traders
More experienced traders often use chart pattern analysis in conjunction with other tools. Patterns like head and shoulders or a double top become more reliable when they form after a long-term upward trend or downward trend. Understanding market trends and market conditions adds a layer of confirmation to your analysis. Advanced traders also look at longer-term phases such as accumulation and distribution patterns, which are not chart patterns in the strict sense but can signal a major shift in the market. These complex patterns require a deeper understanding of market psychology and volume analysis.
FAQs About Chart Patterns
Q: What are the most common chart patterns?
A: The most common chart patterns include the double top, double bottom, head and shoulders, and various triangle patterns. These are popular because they appear frequently and provide clear signals.
Q: Are chart patterns reliable?
A: No single tool is 100% reliable. The best way to use chart patterns or stock charts is to combine pattern recognition with other forms of technical analysis, like using technical indicators or volume analysis. You should also consider the broader market trends and market volatility.
Q: What’s the difference between reversal and continuation patterns?
A: The key difference lies in the signal they provide. Continuation and reversal patterns are used for different purposes. A continuation chart pattern suggests the trend will continue in the same direction. A reversal pattern suggests a potential change in the trend. Examples include head and shoulders, double top/bottom, and often the falling wedge. Patterns such as the descending triangle are classically classified as bearish continuation chart patterns, although they can occasionally act as reversals.
Conclusion
Understanding price patterns is a core skill for any trader. By learning to identify common reversal patterns and continuation patterns, you can gain an edge in the market. It’s important to remember that these are not standalone signals and should always be used as part of a more comprehensive trading strategy. Chart patterns are probabilistic tools, not guarantees. Their reliability depends heavily on the prior trend, the quality of the breakout (close and volume), and risk management. Expect failed patterns and protect yourself with clear stop-loss rules.
The most important step is to practice. Don’t risk your capital until you’re confident in your ability to spot and trade these patterns consistently. Test your trading strategy with a demo account to see how you perform under real-world conditions. Once you’re ready, consider taking on a funded trading challenge to apply your skills in a professional environment with the upside of earning profits from it.

Disclaimer
This content is provided for educational purposes only and should not be interpreted as financial or investment advice. Trading in forex, stocks, or any other financial markets involves significant risk. You may lose more than your initial investment, and past performance does not guarantee future results.
Always consider your personal financial situation, level of experience, and risk tolerance before trading. If necessary, consult with a licensed financial advisor or qualified professional. Any strategies, tools, or examples mentioned are for illustration only and do not represent a complete guide.


