
If you’ve been in forex trading for a while, you know how important it is to spot signs of a trend reversal early. One of the clearest signals is the shooting star candlestick. It’s one of the classic shooting star patterns within the family of candlestick patterns, and if you understand how it forms, when it appears, and how to confirm it, you can use it to sharpen your decision-making and keep a step ahead.
This guide will walk you through what the shooting star candlestick pattern is, how to identify it, and how to build trading strategies around it as you work toward a funded trading account with ThinkCapital.
What Is a Shooting Star Candlestick?
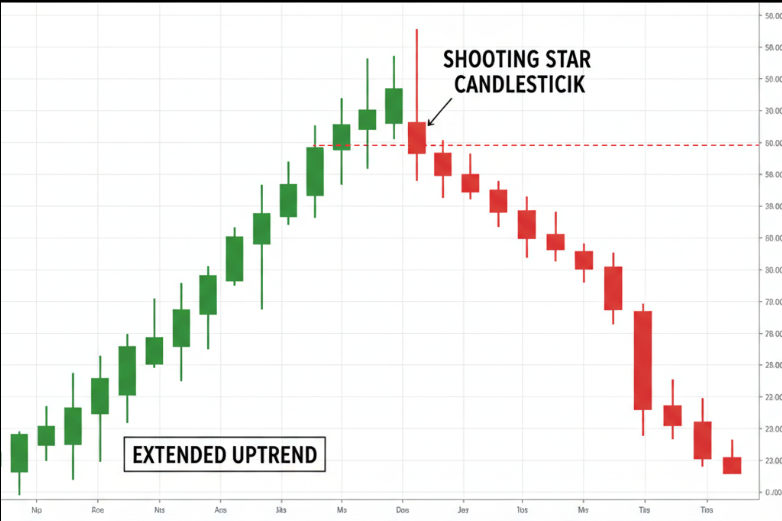
A shooting star candlestick is a bearish pattern that develops after a strong uptrend. It’s a warning that bullish momentum may be fading and that a potential shift in control is underway.
Here’s how to spot it during a trading session:
- Small body: The opening and closing prices are very close together. Even a small bodied candle can signal rejection if it appears at the right level.
- Long upper shadow: At least two to three times the body. This long wick shows buyers tried to push higher, but strong selling pressure forced the price back down.
- Little or no lower shadow: Confirms the rally was rejected.
- Context is everything: The shooting star forms only at the top of an extended uptrend. Without that, it’s just another star candlestick.
What the Shooting Star Suggests
The shooting star suggests a potential price decline and warns of a bearish reversal pattern. The upper shadow and long upper wick tell the story: there was buying pressure early in the session, but the bears managed to push the market back to the opening level by the close.
This shift in market sentiment highlights why the pattern is one of the most respected trading patterns for spotting reversals.
Shooting Star vs. Inverted Hammer
The star candlestick pattern can take several forms, which is why traders sometimes confuse the shooting star with the inverted hammer. Both look identical, but:
- Shooting Star: Appears after a solid uptrend, warning of a potential bearish reversal.
- Inverted Hammer: Appears at the bottom of a decline, hinting at recovery.
If you hear someone call the shooting star candlestick bullish, they’re mixing it up with the inverted hammer.
How to Trade the Shooting Star Candlestick
Spotting the shooting star candle is just the start. To avoid false signals, you need to confirm it before acting.
Here’s a step-by-step trading plan:
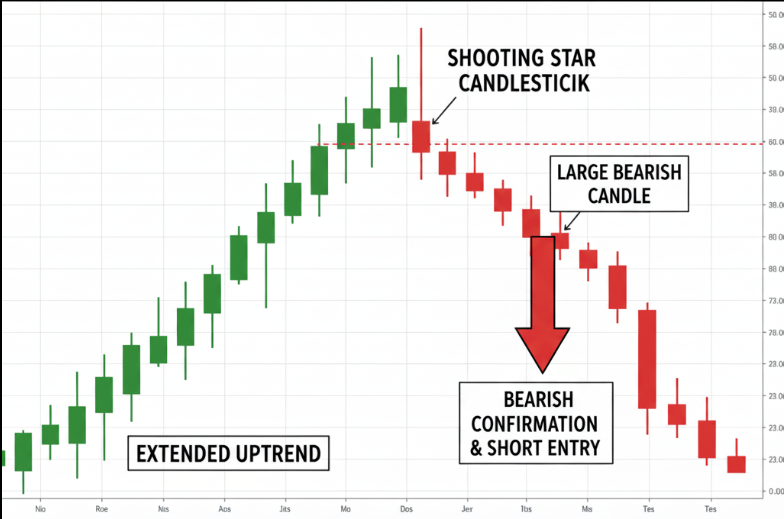
- Check the first candle – Often, the candle before the shooting star is a large bullish candle, reinforcing the prior uptrend..
- Identify the star – Look for the shooting star candle with a small body and long upper shadow, ideally near a significant resistance level.
- Wait for the next candle – A strong bearish candle or large bearish candle closing below the low of the star provides the confirmation you need.
- Consider a short position – After confirmation, consider a short position. Place a stop-loss above the shooting star’s high or opening price to manage risk.
- Use volume analysis – Strong trading volume adds weight to the reversal.
- Lean on technical analysis – Pair the pattern with technical indicators like RSI or MACD to confirm the potential reversal.
Variations and Related Patterns
- Bearish Shooting Star Candlestick Pattern: The most reliable version, especially when followed by a strong bearish candle.
- Green Shooting Star: Less reliable, but still a warning sign of a potential bearish reversal.
- Shooting Star Inverted Hammer Candlestick Pattern: Same look, different context.
- Other Patterns: The evening star, hanging man, gravestone doji, or three candles sequences help measure the pattern’s reliability and broader market conditions.
Common Mistakes to Avoid
- Ignoring the broader chart pattern and treating the shooting star as a standalone signal.
- Acting too quickly without confirmation from the second candle.
- Overlooking market moves triggered by economic news.
- Forgetting proper risk management, which protects you from false signals.
Preguntas Frecuentes:
Q: Is a shooting star candlestick bullish?
A: No. It’s a bearish candlestick that usually warns of a reversal pattern. The confusion often comes from the inverted hammer.
Q: How to confirm a shooting star candle?
A: Check for the next candle: ideally a strong bearish candle closing below the star. Add volume analysis and technical indicators for confirmation.
Q: Which candle is the most bullish?
A: Patterns like the bullish engulfing candle or the hammer are stronger than a single star. They show a clear rejection of selling and strong buying pressure.
Q: What does the shooting star’s high tell us?
A: It’s the level buyers failed to hold. Many traders use it as a reference point for stop-loss placement.
Q: Can the shooting star appear in stocks too?
A: Yes. The shooting star stock pattern is widely used in forex, stocks, and commodities.
Final Thoughts
The shooting star candlestick pattern is one of the clearest visual warnings of a potential bearish reversal. By studying the first candle, the shooting star candle, and the next candle, traders can anticipate price movements more effectively.
At ThinkCapital, we believe in helping traders move from theory to execution. If you’re ready to prove your edge and aim for payouts, explore our funded trading program.

Disclaimer
This content is provided for educational purposes only and should not be interpreted as financial or investment advice. Trading in forex, stocks, or any other financial markets involves significant risk. You may lose more than your initial investment, and past performance does not guarantee future results.
Always consider your personal financial situation, level of experience, and risk tolerance before trading. If necessary, consult with a licensed financial advisor or qualified professional. Any strategies, tools, or examples mentioned are for illustration only and do not represent a complete guide.