Guesswork ruins accounts. That’s why many professional traders and institutional investors rely on Volume Spread Analysis (VSA) — a trading technique that interprets market data through the relationship between price spread, trading volume, and the closing price to reveal signs of smart money activity.
For traders working toward a funded account in forex trading or other financial markets, understanding Volume Spread Analysis VSA provides a critical edge for making informed trading decisions.
VSA’s heritage traces back to the early 20th century. Richard Wyckoff developed the original supply and demand framework, and in the 1970s Tom Williams built on this work, formalized the approach, and popularized it under the name Volume Spread Analysis. This historical foundation underscores why VSA remains one of the most widely used technical tools for reading market behaviour.
This guide explains what is Volume Spread Analysis, whether Volume Spread Analysis works, and how to apply it to your trading strategy for consistent trading success.
What is Volume Spread Analysis (VSA)? The Key Components
The term Volume Spread Analysis refers to a branch of technical analysis that studies how price bars, volume traded, and opening and closing prices interact. It builds on volume price analysis and the work of Richard Wyckoff, later refined and popularized by Tom Williams.
VSA rests on the idea that professional traders and large investors drive real market moves, and their footprints are visible in volume bars and price patterns.
Key components of Volume Spread Analysis (VSA):
- Price Spread: the difference between the highest and lowest price in a bar or candle. Wide spreads often signal strong activity and market participation, while narrow spreads show hesitation or lack of interest.
- Opening and Closing Prices: the starting and ending prices of the candle’s body (high, low, or middle), which reveal market sentiment.
- Trading Volume: the number of trades or activity behind each move. The volume levels and their relationship with spread and closing price are critical.
By combining spread analysis, price action, and volume analysis, traders can infer market intentions and shifts in market conditions.
Forex note: In forex, most platforms display tick volume (a “tick” means a price change or update, not an actual contract). It strongly correlates with true activity, but less so in thin sessions such as the Asian session or holidays. Still, it remains the standard proxy for volume spread analysis.
The Three Basic Laws Behind Volume Spread Analysis (VSA)
VSA applies Wyckoff’s three basic laws of the market:
- Supply vs Demand
When demand exceeds supply, prices rise. When supply dominates, price moves lower.
In VSA: True strength is often seen on up-bars after prior weakness that close near the highs on good volume. Wide up-bars into resistance on ultra-high volume usually reveal distribution and potential selling pressure. - Cause vs Effect
Every price move has a cause. The size of the accumulation phase or distribution phase determines the size of the market movements.
In VSA: A long accumulation phase sets up a strong uptrend; a large distribution phase precedes a prolonged downtrend. - Effort vs Result
Effort (volume) should match result (price).
In VSA: High trading volume with little price change shows strong opposition from smart money. Low volume with a significant price move often signals a weak trend unlikely to last. Example: If there’s a lot of trading activity (effort) but price barely moves (result), it signals hidden supply or demand at work.
Reading Price Action, Volume Bars, and Market Sentiment
VSA trains traders to read price action, volume bars, and candlestick patterns to uncover market sentiment:
- Effort to Rise (No Result): Wide spread, high volume, close near low → weakness, distribution likely.
- Supply Test: Narrow spread, low volume, close near high → strength, smart money activity confirming supply is exhausted.
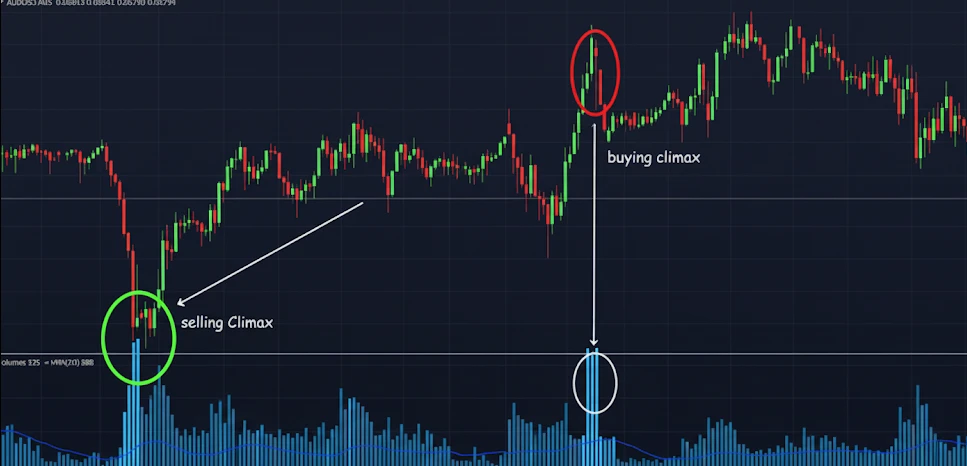
- Buying Climax: Very wide spread, ultra-high volume traded, close mid/low → large investors distributing to retail buyers, reversal expected. Context matters — this typically appears at the end of a prolonged uptrend.
- Selling Climax: Very wide spread, ultra-high volume, close mid/high → panic selling, with strong hands accumulating, reversal likely. Context matters — this usually occurs after an extended downtrend.
- No Demand: Narrow spread up-bar, low volume lower than the previous two bars, close mid/low → lack of professional buying, often before markdown.
Divergences between price and volume are key:
- A new low on low volume suggests selling pressure is drying up.
- A new high on low volume warns that demand falls short of sustaining the move.
Identifying Market Trends and Market Phases with Volume Spread Analysis (VSA)
VSA helps traders identify market trends and key market phases. Building on Wyckoff’s work, markets typically cycle through four stages: Accumulation, Markup, Distribution, and Markdown.
1. Accumulation Phase (Buying Low Before Markup)
- Definition: Smart Money (institutions) quietly build positions in sideways “congestion” areas where price is flat.
- Signs: Selling climax, narrow candle spreads, volume higher at the top of the range than the bottom, followed by supply tests on low volume.
- Explanation: Accumulation is when large players gradually buy while price looks stuck in a range. It usually goes unnoticed by retail traders.
- Result: Sets the stage for the next uptrend.
2. Markup Phase (Trend Expansion)
- Definition: After accumulation, Smart Money pushes price higher.
- Signs: Candles form higher lows and close near the highs; short pullbacks occur on low volume. Rising prices come with relatively smooth moves because sellers are scarce.
- Explanation: Markup is the uptrend phase where prices climb steadily, and small dips are bought quickly.
- Result: Sustained uptrend until a buying climax forms.
3. Distribution Phase (Selling High Before Markdown)
- Definition: Smart Money unloads positions to Weak Money (fearful or uninformed retail traders) without crashing price immediately.
- Signs: Buying climax followed by narrow up-bars on high volume, weak rallies on low volume, and congestion zones near highs.
- Explanation: Distribution is when big players sell into strength, passing positions to latecomers who expect the trend to continue.
- Result: Market tops out, preparing for markdown.
4. Markdown Phase (Sharp Downtrend)
- Definition: Once Smart Money exits, price declines rapidly.
- Signs: Wide down-bars, heavy selling pressure, and panic selling by Weak Money. Often ends with Stopping Volume (a high-volume bar that halts the fall) or Absorption Volume (large buying absorbing panic selling).
- Explanation: Markdown is the decline phase where prices fall quickly, fueled by panic. It usually ends when volume shows big buyers stepping in again.
- Result: Downtrend that eventually transitions back into accumulation.
5. Confirming Price Direction
- Strength: Rising volume, wide spreads, breaks of key levels supported by market data.
- Weakness: Failed rallies, rejection on spread bars, price lower on high volume.
VSA in Day Trading and Risk Management
In day trading, VSA is a widely used technical tool for timing and risk management:
- Entry and Timing: Many traders use signals like supply tests or selling climax to enter near turning points instead of chasing breakouts.
- Risk Management: Traders often place stops just beyond the high or low of price bars showing supply/demand exhaustion such as stopping volume or a confirmed test. Position sizing should also account for volatility to keep trading capital protected.
- Market Changes: Narrow spreads on rising volume after a steady move warn of potential price changes.
For funded accounts, this precision is vital: protecting drawdown limits while capturing valid market moves is the key to trading success.
Does Volume Spread Analysis Work?
Does Volume Spread Analysis work? Many traders find it effective across forex trading and other financial markets because it tracks the activity of professional traders and institutional investors.
- Why it works: It interprets the footprints of smart money activity, allowing traders to anticipate market phases before traditional indicators react.
- The caveat: VSA is discretionary. Correctly interpreting price bars, volume spread, and price action requires screen time, practice, and a reliable trading platform.

Frequently Asked Questions (FAQ)
Q: What is the biggest advantage of Volume Spread Analysis?
A: It allows traders to read the behavior of institutional investors by studying the relationship between volume spread, price bars, and trading volume. This helps anticipate market trends and reversals.
Q: How do I identify market reversals with VSA trading?
A: Look for climax events: a buying climax (wide bar, ultra-high volume, close near low) or a selling climax (wide bar, ultra-high volume, close near high). Confirmation comes with a supply test or weak rally on low volume.
Q: Does VSA work with candlestick patterns?
A: Yes. Candlestick patterns show opening and closing prices and price spread, while VSA adds the missing layer of volume analysis. Example: a Doji with ultra-high volume signals intense trade between buyers and sellers, often before market phase change.
Q: How does VSA help with risk management?
A: By tying stops to spread analysis with volume and key levels, VSA defines logical risk points instead of arbitrary ones. This protects trading capital while improving reward potential.
Ready to Trade with Professional Insight?
Volume Spread Analysis VSA is a widely used technical tool that helps traders move from reactive to proactive. By analyzing price spread, trading volume, and price action, you can align with smart money and adapt to changing market conditions.
The next step is practice. Apply these principles in real financial markets and test your skill in a funded environment.
Volume Spread Analysis helps you trade with smart money, not against it. Start your ThinkCapital funded trading challenge today.

Disclaimer
This content is provided for educational purposes only and should not be interpreted as financial or investment advice. Trading in forex, stocks, or any other financial markets involves significant risk. You may lose more than your initial investment, and past performance does not guarantee future results.
Always consider your personal financial situation, level of experience, and risk tolerance before trading. If necessary, consult with a licensed financial advisor or qualified professional. Any strategies, tools, or examples mentioned are for illustration only and do not represent a complete guide.